Registration and retention
One of the pleasant things about digging through community data is you sometime stumble across a dynamic you hadn’t considered before. For instance, I found something odd looking at this graph:
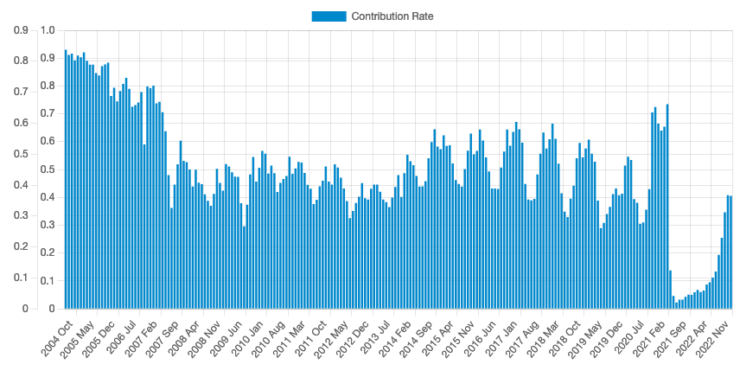
I’m grouping College Confidential users by the month they joined and looking to see if they posted in the 30 days after they join. The idea came from a graph from Richard Millington. Generally speaking, we want higher contribution rate because that leads directly to community growth. Considering the effort someone might go through to create an account, it’s disheartening to see when something stops them from following through on engaging with the community.
Normal pattern of participation
Sites often start out1 with a high contribution rate since there’s usually no reason to register unless you plan to post. As College Confidential became the place for college admissions, more students and parents registered without posting. Perhaps it was because they thought they would gain some advantage (we send out regular emails that do provide useful information) or maybe because it’s something “everybody should do”. Whatever the reason, fewer people posted within the first 30 days.
Then from 2007 to 2020 the graph settles into a seasonal pattern. The basic outline becomes obvious when you look at a single year of new users by month. I picked the 2018–2019 academic year as it’s one of the last years with the pattern.
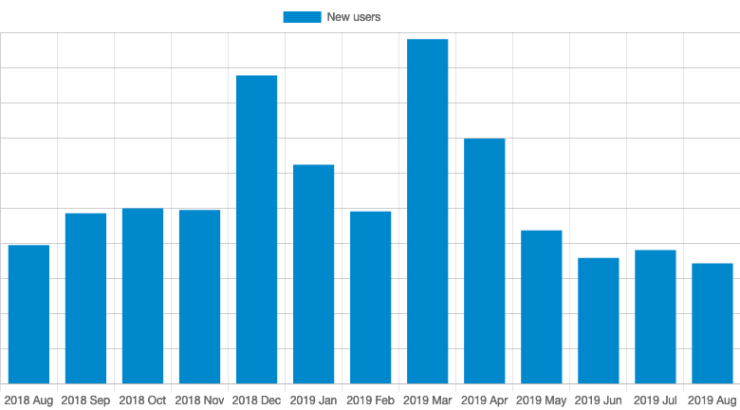
Every year we see a small spike in interest in December in anticipation of applications being due in January. Then there is our big spike in March (AKA March Madness) when acceptance and rejection notices are sent out. It’s exciting and people really do want to participate. As everyone finds out where they have been accepted and makes their decision, the conversation moves away to other parts of the internet.2
The contribution rate follows a smoothed copy of the pattern. People who join in the big December and March rushes are more apt to contribute right away too.
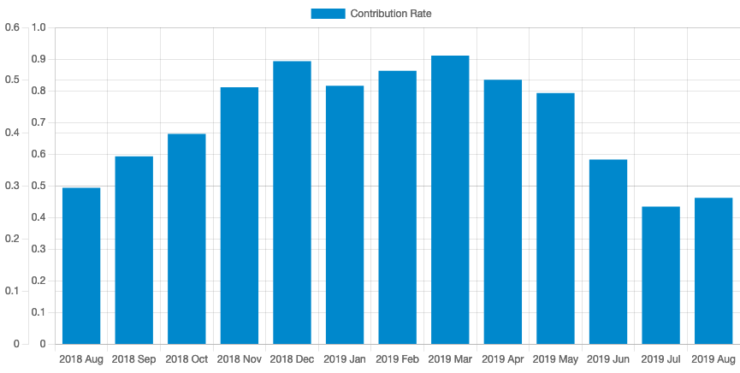
(There are two Y-axis labels because the Discourse Data Explorer has one for the actual values and a second, rather pointless, set of labels that shows the relative height of the bars or something. Focus on the far left labels. So roughly 55% of people who join in December or March contribute. It drops below 30% in the summer.)
In the summer months, there’s not a big urgency to post because there’s not a lot of news in the admissions world. Everyone is taking a summer break and preparing for the start of classes in the fall.
Next I looked at retention rate after 3 months. It doesn’t matter if I look at how often they are still visiting or still posting, the results look about the same. For this graph, I checked if the last day a user visited was at least 3 months from when they joined.
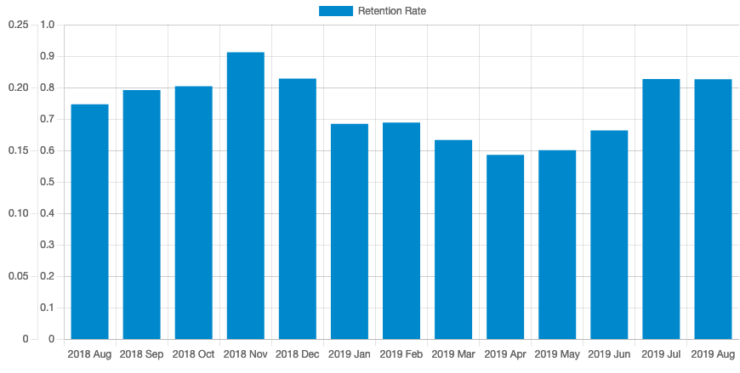
(Again the graph labels are odd. Peak retention rate is less than 25%, not over 90%. Ignore the inside labels. It would be nice if I could get all these graphs to be on the same scale. I really should be using R or some such.)
This is where things get strange. The best retention happens in November and drops as our two spikes happen. Joining in the summer is a pretty good sign you’ll stick around for at least 3 months. How can that be?
The better way to ask the question is “Why don’t people who join in March come back later?” That’s way easier to answer: if you come to find out who got into selective schools (and maybe brag about being accepted), your purpose is fulfilled by summer. It’s a mindset that’s quite temporary. People who join the summer might have some reason to participate, but it’s not as likely to be focused on a single application season.
What the heck happened in 2021?
Of course the thing that actually stuck out was what happened in 2021. Here’s the contribution rate for the 2019–2022 academic years:
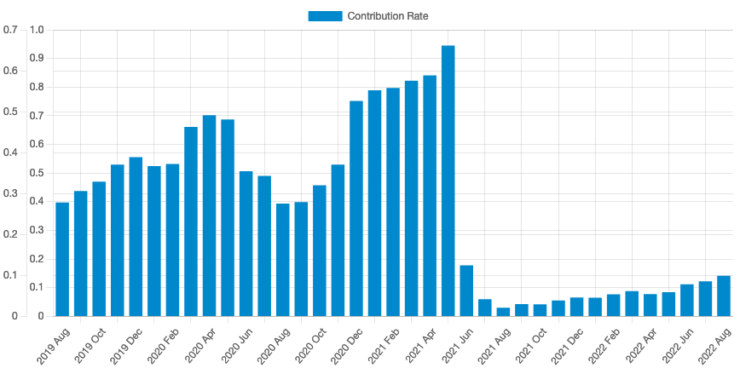
Before we get to the huge drop in the summer of 2021, notice that new users contributed more from December 2020 to May of 2021. At least part of the reason is that we moved form Vanilla Forums to Discourse in November. Discourse does a great job encouraging participation and CC was starting to see the benefit of that. By May of 2021, we were seeing almost 2/3rds of registered users post in the first 30 days. That’s better than the heydays of 2014–2018. And then a sudden collapse to 2% by August. What happened?
For a hint, let’s look at new users in that same time period:
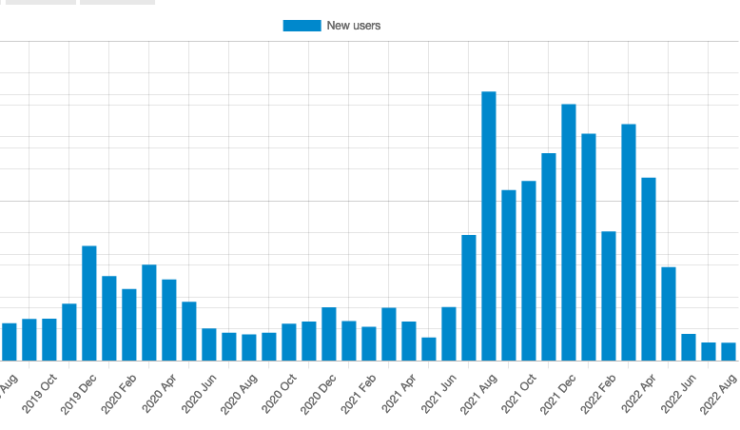
Just compare those charts. Contribution rate fell at the same time that new user registration spiked. In turn, the reason registrations increases was because of this aggressive popup:

What might not be clear from this screenshot is that the X button on the right in the lower third of the screen dismisses the video. While there was a way to dismiss the “Join Our Community!” popup, it returned if you navigate to a new page. As some point, it became essentially impossible to read the site without registering.
So for most of the history of College Confidential, the only reason to register was to post. But when the registration popup stopped people from reading, registration didn’t signal an interest in participation. So the denominator got larger without a matching increase in the numerator. It’s not surprising that the contribution rate plummeted.
Deciding to pursue increased registration might be the right decision. For instance, a business that depends on collecting leads will want to encourage people to provide contact information. If the quality of information is known to be high, many people will be willing to give up a bit of personal information to get access. It’s a mistake to focus on engagement rate if some other metric is more closely tied to your strategic goals.
Ultimately, we decided the benefit of more registrations wasn’t worth the cost of limiting our audience.3 In June of 2022, College Confidential became an independent entity. Leads are still important to our business, but with a change in perspective, we saw that gating all of our content behind a registration wall wasn’t the right strategy for the long-term. Instead we are shifting to other strategies for encouraging registration.
SQL queries I used to get my data
Contribution rate by join month
SELECT
       to_char(date_trunc('month', u.created_at), 'YYYY Mon') "Join Date",
       cast(sum(case
                  when first_post_created_at-u.created_at <= interval '30 days'
                    then 1.0
                  else 0.0
                end) /count(*) as float) "Contribution Rate"
from users u
     join user_stats s
          on u.id = s.user_id
where u.created_at > '2004-10-01T00:00:00.000Z'
group by date_trunc('month', u.created_at)
order by date_trunc('month', u.created_at)
A few notes:
- The
to_char(..., 'YYYY Mon')andcast(... as float)functions were added purely to convince the Discourse Data Explorer to display a graph. - Using
1.0and0.0instead of1and0convinced PostgreSQL to do floating point arithmetic rather than integer arithmetic. - My actual queries are a mess of commented out lines and awkward formatting.
New users by join month
SELECT
       to_char(date_trunc('month', u.created_at), 'YYYY Mon') "Join Date",
       count(*) "New users"
from users u
where u.created_at > '2004-10-01T00:00:00.000Z'
      and u.created_at between '2018-08-01' and '2019-08-31'
group by date_trunc('month', u.created_at)
order by date_trunc('month', u.created_at)
Retention rate by join month
SELECT
       to_char(date_trunc('month', u.created_at), 'YYYY Mon') "Join Date",
      cast(sum(case
                 when last_seen_at-u.created_at > interval '3 months'
                   then 1.0
                 else 0.0
               end) /count(*) as float) "Retention Rate"
from users u
where u.created_at > '2004-10-01T00:00:00.000Z'
      and u.created_at between '2018-08-01' and '2019-08-31'
group by date_trunc('month', u.created_at)
order by date_trunc('month', u.created_at)
In this case it was a new platform. CC has been around since 2001, but everyone needed to sign into a new system in 2004. The effect is almost the same as a new community because people could see the content without registering and the main reason to get an account on the new system was to post something.↩︎
One of my goals is to keep freshmen on CC. We know they meet on other platforms after forming a relationship on CC. More importantly, their voices would be a real help to high school seniors going through the process they just finished.↩︎
One problem wass that some people were clearly reluctant to tell the truth on the registration form. It’s not much help to have useless leads.↩︎